 The municipal bond market experienced one of its most disruptive and volatile market periods in recent memory during the week of March 9, 2020. After steadily moving higher for past 15 months as the Federal Reserve initiated a new easing policy, municipal bond prices declined sharply last week in response to increased economic disruption brought about by the rapidly evolving coronavirus pandemic.
The volatility in municipal bond prices and municipal bond fund mutual funds last week was indeed both abrupt in its speed and significant in magnitude. However, such municipal bond market behavior has in fact occurred on several occasions in the past thirty years. In the context of these prior periods, the price and trading activity in the municipal market last week reflected the very “normal” manner in which the municipal bond market has behaved in “abnormal times”.
Also in the context of the overall municipal bond market, the intermediate maturity and investment grade mandate, in which all Aquila municipal bond fund portfolios are structured, helped deliver less fluctuation than that of long term bonds last week.
Unusual – But Not Unprecedented
On March 12, 2020, the Net Asset Value of the Aquila Tax-Free Trust of Arizona’s (ATFTA) Class A Share declined 2%. This compared to long term bond funds who suffered Net Asset Value (NAV) declines of as much as 3%, and large actively traded national municipal bond Exchange Traded Funds (ETFs) which dropped 5% that day. This greater degree of downside stability reflected the benefits of both the intermediate mandate and very broadly diversified portfolios that are the foundations of our locally managed municipal bond funds. You may find the Fund’s latest performance here.
This magnitude of one-day price fluctuation was not unprecedented though. On Tuesday April 4, 1994 intermediate and long term municipal bond NAVs also declined 3%-4%. I had the opportunity to experience this market turmoil firsthand while co-managing two investment grade, single-state bond funds with short term and long term maturity mandates at the time. On that day, coming off an extended Easter holiday weekend, the Federal Reserve made a surprise increase in the discount rate as part of a significant monetary tightening they had started at the beginning of 1994.
By the end of that Tuesday, the 10-year US Treasury bond yield increased 39 basis points from 6.75% to 7.14%, and the 30-year US Treasury bond yield spike 32 basis points, from 7.10% – 7.42%. The Bloomberg Barclays AAA 10-year Maturity Index yield rose a more modest 25 basis points. This sudden spike in yields along with very thin trading activity in a volatile market translated into the sharp NAV declines of that day. The Class A Share of ATFTA declined 19 cents that day, fairly commensurate with the unusually large one day declines experienced last week. One difference in these two periods is that last week’s volatility was induced by significant economic stress, rather than Federal Reserve policy and the long term direction of benchmark interest rates. Last week also shared common themes with the height of municipal market volatility that occurred near the end of 2008 during the great recession.
Over a three-week period from the week of November 18th to December 15th in 2008, the NAV of ATFTA declined 4.4% as the shadow of corporate bankruptcies and bailouts weighed on the municipal bond market. Long-term funds suffered even sharper declines of as much 7%. Again, we believe an intermediate maturity focus and portfolio breadth helped to mitigate a good degree of the downside risk of this period.
What was mostly unusual about this period was that US Treasury bond yields moved significantly lower throughout this period as the Federal Reserve aggressively moved to inject liquidity into the market. For example, 10-year US Treasury bond yields declined from 3.77% to 2.51% even as comparable AAA municipal bond yields increased 32 basis points to 4.44%. The polar opposite behavior of these markets was even more pronounced in the long end of the yield curve. Benchmark 30-year US Treasury yield declined from 4.23% to 2.95%, while the Bloomberg Barclays AAA 30-year Maturity Index yield increased 63 basis points to 5.77%.
The Return of Genuine Relative Value
This window of volatility behavior near the end of 2008 was similar to what the muni market experienced last week, as the increase in municipal bond yields were double those of benchmark US Treasury bonds. This resulted in a significant underperformance of the municipal bond market that has left municipal bond yields at compelling valuations which are reminiscent of those in December 2008.
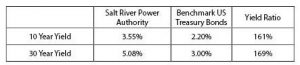
As of this writing, Bloomberg Barclays Fair Value 10-year and 30-year AAA municipal bond index yields equal 210% and 173% of comparable maturity US Treasury bonds. In December 2008, those same yield ratios were 177% and 196% respectively. For real market perspective, look at the yields offered in a $709 million Salt River Power Authority Bond issue that came to market the week of January 12, 2009:
The Search for Value is Not a Predictive Exercise
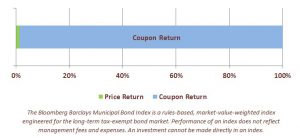
It is important to put municipal bond price volatility, elevated municipal bond yields, and tax exempt/taxable yield ratios in their proper perspective. In prior thought leadership papers, we have pointed out the importance of components of return in fixed income investing. In particular, it is important to keep in mind that the lion’s share of long run total return in municipal bond investing is derived from the income. The corollary is that over the long run, price changes contribute a small amount towards, and only detract a small amount from, total return.
Total Return Breakdown of the
Bloomberg Barclays Municipal Bond Index Since Inception
Over the very short run (like a very volatile week in March of 2020, or day in April 1994) prices changes can overwhelm income. This is even more true today than in the much higher interest rate landscape of the 1990s and 2000s. Which makes evaluating and staying committed to a well thought out asset allocation plan vital. Doing so enables investors and advisors alike to focus on whether the fixed income tool in an asset allocation plan can provide an attractive level of income after taxes that protects purchasing power, while mitigating a large degree of volatility across the fixed income and equity universe.
Given current stock market volatility and the wild swings in taxable bond prices of the past week, conservative and consistently managed municipal bond portfolios appear to now offer enhanced long run value. Such value is not a guarantee against further fluctuation or price declines, but rather an indicator of the degree to which municipal bonds may be able to assist in the achievement of overall asset allocation objectives.
Over the next several weeks, we look forward to sharing further insights into a few of the market dynamics that are unique to the municipal bond asset class, how they shape municipal bond price fluctuations, and the opportunities they present that a local management perspective can capitalize on for shareholders.
Please carefully read the Fund prospectus here. Before investing in one of the Aquila Group of Funds, carefully read about and consider the investment objectives, risks, charges, expenses, and other information found in the Fund prospectus. The prospectus is available on this site, from your financial advisor, or by calling 800-437-1020.
Performance data represents past performance, but does not guarantee future results. Investment return and principal value will fluctuate; shares, when redeemed, may be worth more or less than their original cost; current performance may be lower or higher than the data presented. Class A shares have a maximum sales charge of 4.00%; Class C shares have no initial sales charge, but a 1.00% contingent deferred sales charge applies to Class C shares redeemed within 12 months of their purchase date. Class Y shares have no initial or contingent deferred sales charge. Class A MOP (maximum offering price) returns reflect deduction of the maximum 4.00% sales charge; Class A NAV returns do not reflect deduction of the sales charge and would be lower if that charge were reflected. Class C returns without CDSC do not reflect deduction of the 1% CDSC applicable in the first 12 months; if applied, the CDSC would reduce the performance quoted.
Mutual fund investing involves risk; loss of principal is possible. Investments in bonds may decline in value due to rising interest rates, a real or perceived decline in credit quality of the issuer, borrower, counterparty, or collateral, adverse tax or legislative changes, court decisions, market or economic conditions. Fund performance could be more volatile than that of funds with greater geographic diversification.
Yield refers to the earnings generated and realized on an investment over a specific period of time. Yield is expressed as a percentage based on the invested amount, current market value, or face value of the security, and includes the interest earned or dividends received from holding a particular security.
Yield ratio represents the comparison of the expected yield of one bond to the expected yield of another. A yield ratio is important when deciding whether to invest in one bond or another. Generally, the higher yield is considered better.
The Bloomberg Barclays AAA 10-year and 30-year Fair Value Indexs are representative of the universe of AAA bonds, at the respective maturities, and reflects the fair value, which is halfway between the bid and offer price. The Bloomberg Barclays 10-year maturity AAA Index is representative of 10 year maturity AAA rated bonds. The Bloomberg Barclays 30-year maturity AAA Index is representative of 30-year maturity AAA rated bonds. The Bloomberg Barclays Municipal Bond Index is a rules based market value weighted index engineered for the long-term tax-exempt bond market. Performance in an index does not reflect management fees and expenses. An Investment cannon be made directly in an index.
Independent rating services (such as Standard & Poor’s, Moody’s and Fitch) assign ratings, which generally range from AAA (highest) to D (lowest), to indicate the credit worthiness of the underlying bonds in the portfolio. Where the independent rating services differ in the rating they assign to an issue, or do not provide a rating for an issue, the highest available rating is used in calculating allocations by rating. Pre-refunded/Escrowed bonds are issued for the purpose of retiring or redeeming an outstanding bond issue at a specified call date. Until the call date, the proceeds from the bond issuance are typically placed in a trust and invested in US Treasury bonds or state and local government securities. Non-rated bonds are holdings that have not been rated by a nationally recognized statistical rating organization.